
|
The GDcharts Home Page
|
 |
|
|
The GDcharts Home Page
|
|
GDcharts, by Jim Turner are Perl functions to create Bar, Stacked Bar, Linegraph, Pie, and Gant charts on the fly which are viewable in web-pages and printable from a web-browser. GDcharts is implemented in Perl and uses a Perl version of the "GD-Lib" by Lincoln D. Stein to dynamically generate printable PNG images with NO JAVA or applets NEEDED!
CGI and Active Server Page (ASP) programs, written in Perl or C can use the GDcharts functions to create beautiful color charts on the fly for display and printing on web-pages. You do NOT have to know Perl to use these routines (but it does help ;-) ), click on the "C" link above for information on calling Perl routines from C programs.
Please Note: You will probably need to edit your GD*chart.pl modules searching for "rgb.txt", and changing the path to the correct one for your system! If you are running Windows, you will probably need to download this file from the link above, save it somewhere, ie. "c:/winnt/system32/rgb.txt", and edit your GD*chart.pl modules to change the path to point to it there, using forward slashes (lower-case question-marks) instead of the Micro$oft backslashes to separate the directory name(s).
Add the following lines to your Perl program, depending on which type(s) of charts you wish to display:
	require "GDbarchart.pl" #TO DISPLAY VERTICAL SINGLE AND MULTI-PART BAR-CHARTS.

	require "GDstackchart.pl"; #TO DISPLAY VERTICAL STACKED MULTI-PART BAR-CHARTS.

	require "GDlinechart.pl"; #TO DISPLAY LINEGRAPHS (SINGLE OR MULTIPLE).

	require "GDbarlncht.pl"; #TO DISPLAY BAR / LINE COMBO-CHARTS.

	require "GDpiechart.pl"; #TO DISPLAY PIE CHARTS.

	use GDgantchart; #TO DISPLAY GANT CHARTS.
To create and display chart, for example, a bar-chart:
	my (@xvalues) = (qw(1993 1994 1995 1996 1997 1998));

	my (@xlegend) = (qw(Spring Summer Fall Winter));

	my (@yvalues) = (5,15,25,35,96,70,60,50,-12,-2,16,32,44,33,22,11,0,13,26,39,21,77,36,69);

	my ($g0) = &BarChart(
		-xvals => \@xvalues,
		-yvals => \@yvalues,
		-xlegend => \@xlegend,
		-maxxsiz => 640,
		-ybase => 0
		);

	if (open(PNG,">/tmp/mychartfile.$$.gif")) {
		binmode PNG;
		print PNG $g0->png;
		close PNG;
	}
	print <<END_HTML;
	<HTML>
	...
	<IMG SRC="http://server/cgi-bin/loadgif.pl?gif=/tmp/mychartfile.$$.gif">
	...
END_HTML
NOTE: The "http://server/cgi-bin/loadgif.pl?gif=" part is optional. If used, You will need to have the tiny CGI script "loadgif.pl" installed in your servers' CGI directory. The purpose of "loadgif" is to automatically delete the temporary PNG image file after the image is loaded into the browser. Some browsers, ie. Netscape 4.07 or later do not seem to work when using loadgif. Another way to delete the temporary png files is to use a cron job to periodically delete them.
The "$$" part of the filename represents the Unix or Windows Process-id for the CGI script which generated the chart. In Perl, this is accessed via the "$$" variable. The Process-id ensures that the temporary png file is unique to it's respective web page, since multiple web clients may be accessing the same page at about the same time, it is potentially possible for non-unique temporary file-names to be overwritten by a second web client user between when it is generated and displayed by the first web user. If you do not have access to "loadgif.pl", you can still display the image, but it will be necessary to periodically clean up the temporary file(s) created by your web users.
This creates a very basic multibar chart, which you can reference in an html page, which looks like the following:
There are eight types of charts currently supported: Bar, Multibar, Stacked bar, Linegraph, Pie, Rockpile, and Gant. Numerous options are supported for controlling the appearance of each type of chart. Most options are the same among the different types, and individual options are simply ignored by charts of types which do not support them. Options are specified in the basic Perl form:
-optionname => value, -optionname2 => value2, ...
Values can be numeric, or string and atom or list, depending on the option. The only required options are "-xvals" and "-yvals", which each specify a list of values to be plotted. In the example above, the additional options: "-maxxsiz", "-maxysiz", and "-ybase" are also specified to produce a more desirable chart for the example. The first two specify the size in pixels of the graphic, and "-ybase" is needed because some of the y-values are negative and some are positive. The following is a list of each supported option with a brief description.
Where possible, when values that control layout and appearance are not specified, the software attempts to provide desirable defaults. This permits the user to specify some constraints and allow others to be suitably calculated to accomodate them.
Specifies one or more numbers or strings to be plotted along the horizontal axis. For GANT charts, these values are just displayed along the top of the chart and can be any valid strings. If "-xticks" is also used, there should be 1 less value than the number of xticks values.
Specifies one or more numbers to be plotted along the vertical axis.
Bar/Line Combo-charts: Specifies one or more numbers to be plotted as lines along the right vertical axis.
Specifies the total chart image width in pixels. If not specified, the size of the chart is calculated from the "barxsiz", the number of bars, the margins, etc.
Specifies the total chart image height in pixels. If not specified, the size of the chart is calculated from the range of y-values to plot, the margins, legends, titles, etc.
Specifies the width of each individual bar in pixels. If not specified, it is calculated based on "maxxsize", the number of bars (x-values), the width of each x-value, etc. NOTE: for multibar charts, this width is the width of all bars for each x-value, so a pixel value representing n times the desired width of each colored bar should be specified where n is the number of y-values per x-value.
Specifies a multibar, stacked bar, or multiline chart by specifying a list of numbers or strings to be displayed as a legend. NOTE: The total number of y-values must be the same as the number of items in the -xlegend list times the number of items in the -xvals list. The values will be plotted left to right in the order they appear in the -yvals list. Review the -yvals list and the example multibar chart above for a clearer picture on how this works. Multiline legend values can be created by including linefeeds (\n) in any or all of them.
NOTE: For stacked bar-charts, the xlegend values can be split into multiple entries via line-feeds (\n). This combined with the "-xbreak" option can create multi-bar stacked charts. For example, consider 7 stacked items split among 2 bars (3 in the 1st, 4 in the second): The colors will automatically cycle properly for each group (7 colors in the example below) The chart would look something like the following example:
	-xlegend => ("one\nfour", "two\nfive", "three\nsix" "\nseven"),
	-yvals => (3, 1, 2, '', 2, 5, 1, 1, 1, 3, 2, '', 1, 1, 1, 1),
	-xbreak => 2,
	-barpct => 100,
	-legendlinkpath => 'http://myurl.domain.com/cgi-bin/mycgi.pl?value=*',
	-legendlinks => (1, 2, 3, 4, 5, 6, 7),
	-mapname => 'myimagemap',


|
|      777
|      666
|      555
|   333555      333
|   333555      333
|   222555      222777
|   111555      222666
|   111444      222555
|   111444      111444
__________________________

[] one  [] two  [] three
[] four  [] five  [] six  [] seven
Stacked charts: Default is 1. If specified, causes that number of bars to be grouped together by inserting whitespace (a break) between the groupings. For example to get stacked bars in pairs, specify a value of 2 for -xbreak.
Stacked charts: Default 100. If "-xbreak" is set to a value greater than 1, then a gap equal to the width of a full single bar is inserted between every group of bars. To change the width of this gap, specify a value other than 100 for "-xbreakpct". For example to separate multibar groupings by 1/2 a bar's width, specify 50.
GANT charts only -- Specifies an optional list of actual dates (in yyyymmdd format) to control the placement of the "tickmarks" along the top horizontal axis above the chart. This is useful when tickmarking by month where it is necessary for the tickmark spacing to be slightly variable due to varying length months. The "-xvals" values are still the ones displayed. NOTE: The "-xticks" list should have 1 more element than the "-xvals" array since the tickmarks include both the left and right edge of the chart! If not specified, the tickmarks are evenly spaced between the x values. For best results, the 1st and last xticks values should be the same as the -starttime and -endtime values in that these two values alone determine the actual range of the chart.
Specifies the y-value represented by the horizontal axis. Default: lowest y-value If using both positive and negative y-values, this option should be specified as zero.
Specifies the number of horizontal grid-lines to be displayed. The default is 4 if -yInc is not specified. NOTE: If Either -yloval and -yhival or -yInc should also be specified to prevent odd or fractional values from being displayed along the vertical axis.
Line-charts only: Default 0: If set, causes the horizontal grid-lines to be hashed, rather than solid.
Specifies a distance in y-values between each horizontal grid-line. This option can be used in conjunction with -ygrid to obtain more desirable results when the range of y-values is not known. If -ygrid is not specified, the number of horizontal grid lines will be determined by the minimum and maximum y-values plotted, or, by -yloval and -yhival, if specified. If -ygrid is also specified, yInc will be first used to determine the minimum increment of y-values to be displayed along the vertical axis and will then be multiplied as necessary to accomodate the range of y-values given. This is useful when the range of y-values is not known to prevent odd or fractional y-values from being displayed on the vertical axis.
Example: Suppose, the range of possible y-values is unknown until run-time, but we want the plot divided into quartiles (4 grid-lines), but we only want values divisible by 10 to be displayed on the horizontal axis. To do this, we would specify:
-ygrid => 4, -yInc => 10
NOTE: If neither the "yInc" value nor the "yloval" and "yhival" options are specified, then the low, high, and increment values are calculated to produce generally pleasing results (whole number incremental values usually divisible by 100, 10, 5, or 2), based on the "ygrid" value. "ygrid" defaults to 4 unless specified. This is usually the best option, if in doubt about the range of y-values and or what to specify.
Specifies the number of tick-marks to be displayed between each horizontal grid line.
Specifies the lowest y-value to appear on the graph. If not specified and no -yInc value is specified, this will be the lowest numerical Y-value in the list or zero, whichever is lower.
Specifies the highest y-value to appear on the graph. If not specified and no -yInc value is specified, this will be the highest numerical Y-value in the list.
Specifies the number of pixels to display to the left of the vertical axis. If not specified and this value will be calculated for you and will be large enough to accomodate the largest horizontal grid-line y-value plus the y-title, if any, and approximately 1/5 inch of padding. The left margin should normally be left unspecified unless you desire to make it larger than the calculated default value.
Default 20 pixels. Specifies a minimum left margin to be used left of all legends, etc. It is also used as the default top and right margins.
Specifies the number of pixels to display to the right of the vertical axis. If not specified the default is 20 pixels (approximately 1/4 inch).
Specifies the number of pixels to display above of the top of the grid area. and will include the "-title", if specified. If not specified the default is 20 pixels (approximately 1/4 inch) plus the height of the large font (if the "-title" option is specified).
Specifies the number of pixels to display below the bottom of the grid area. and will include the x-values, "-xtitle", y-values (if "-showvalues => 'bottom'), and the legend, if any. If not specified it will be calculated, depending on which of the above items are to appear in it. The bottom margin should normally be left unspecified unless you desire to make it larger than the calculated default value. Be sure, however, to take into consideration any of the above items which will appear in it and allow enough room to avoid chopping.
Specifies various text options for displaying values and totals. If more than one option is specified, separate them with commas. The currently valid values are: "xbottom": display all y-values below chart.
"bbottom": Only display bar y-values below chart (Bar/Line Combo. charts).
"lnbottom": Only display line y-values ("-ylnvals") below chart.
"top": Display y-values above bars if they will fit.
"nobar": Do not display y-values in the bars, even if they will fit.
"total": Sum up each column of y-values for each x-value and display the row of totals below the chart (and below the table of y-values, if one of the "bottom" options is specified).
Specifies the number of pixels wide to draw a rectangle border around the entire image Default is zero (no border) NOTE: -border should probably not be used if also using any of the "-link" options in that the browser will add a bevel to the image to indicate that it is clicable. If specified, the border will be displayed in the "-bordercolor" color (default black).
Specifies a title caption to be displayed in the large font above the body of the chart Default: none. Now, for multiline titles, split with either linefeed (\n) or html break (<BR>).
Specifies a title caption to be displayed horizontally in the small font below the chart but above the legend. Default: none.
Specifies a title caption to be displayed vertically in the small font in the left margin. Default: none.
Specifies a title caption to be displayed in the small font in the lower right corner of the chart. Default: none.
Specifies the name of a color to display all bars (or lines) in. Default: the first color specified in the "-barcolors" list or "SteelBlue"
Specifies a list of color names to display each bar (or line) in. Default: [qw(SteelBlue gray brown4 khaki DarkGreen salmon skyblue bisque3 purple yellow2 olivedrab darkorange)] For single charts, each bar is displayed in the next corresponding color, cycling around to the first after the last color is used. For multi charts, each y-value is displayed in the next corresponding color, but the first y-value for each x-value starts back with the first color so that the colors cycle at least once for each x-value.
Specifies which color in the "barcolors" list the 1st bar should be colored (default is zero meaning the 1st color). Each bar is colored with the next color in the list. If there are more bars than colors in the list, the list starts over with the 1st color. For example, to start with the 3rd color, specify "-shiftcolors => 2".
Specifies the name of a color to display the background in. Default: "white"
Specifies the name of a color to display each y-value in within the colored bars. Default: "white"
Specifies the name of a color to display the horizontal and vertical axes. Default: "black"
Specifies the name of a color to display each y-value in which must be displayed outside of the bars due to the small size of some bars. Default: same as the "-axiscolor"
Specifies the name of a color to display the titles at the top of the chart, if specified (by "-title", "-xtitle", and "-ytitle"). Default: same as the "-axiscolor"
Specifies the name of a color to display the horizontal grid-lines and all tick-marks. Default: same as the "-barcolor"
Specifies the name of a color to display the x-values and the y-values along the horizontal and vertical axes respecively as well as totals and the legend text. Default: same as the "-barcolor"
Specifies the name of a color to display the border (if "-border" is specified). Default: same as the "-barcolor"
This specifies serves as a common url directory path to be appended to each individual link url in the "-link" list. The "-links" values will be appended onto the end of the "-linkpath" string to produce the individual bar urls unless the wildchard character ("*") appears in the "-linkpath" string. Please see the example under the "-links" option below. Default: none
This specifies a list of urls or url parts to make each bar or point "clickable" so that the user can select any individual bar or point(linegraph) or legend value (piechart) and go to a different page. The optional "-linkpath" option allows the common parts of the url to be specified once. Default: none
Example: Suppose one has 5 x and y values (a chart with 5 bars) and a CGI program url which takes as one of its arguments, the x-value of the bar which the user clicks on. Suppose the CGI program is at "http://www.somewhare.com/cgi-bin/mypgm.pl?xvalue=1994&parm2=something", this could be set up as follows:
-linkpath => "http://www.somewhare.com/cgi-bin/mypgm.pl?xvalue=*&parm2=something",
-xvals => [qw(1994 1995 1996 1997 1998)],
-yvals => [(25, 87, 42, 12, 56)],
-links => [qw(1994 1995 1996 1997 1998)]
Note the asterisk in the "-linkpath" string, which, for each bar, will be replaced by the corresponding "-links" value.
Stack charts only -- This specifies a common url directory path to be appended to each individual link url in the "-legendlinks" list. The "-legendlinks" values will be appended onto the end of the "-linkpath" string to produce the individual legend urls unless the wildchard character ("*") appears in the "-legendlinkpath" string. Please see the example under the "-links" option. Default: none
Stack charts only -- This specifies a list of urls or url parts to make each item in the legend so that the user can select any individual legend value and go to a different page. The optional "-legendlinkpath" option allows the common parts of the url to be specified once. Each legen item represents one compnent in the stack. Default: none
This specifies a url hyperlink making the entire image clickable. If the "-links" option is also specified, the url will apply to any area of the chart not covered by one of the "-links" or "-legendlinks" links. Default: none
This specifies a text string to display on the status line at the bottom of the browser window when the user moves the mouse over the chart.
This specifies a list of text strings to display on the status line at the bottom of the browser window when the user moves the mouse over the corresponding bar/point/legend value in the chart. NOTE: The current version only supports a single -links and -mouseovers value for each y-value. The PieChart has the exception that one additional "-mouseovers" value may be specified which will appear over the "Totals:" line at the bottom of the legend.
The default is to specify the "-mouseover" string, "-links" string, or, the "-link" string, or, if neither is specified, nothing (If a given "-mouseovers" value is undefined, the "-links" value... is displayed, if defined. If defined, but set to an empty string, nothing is displayed. This effectively hides the link value from the user, but it remains a clickable, usable link).
NOTE: You must have JavaScript enabled for "mouseovers" to work.
Also note: Creating mouseovers without links creates empty links. If the user clicks on a bar with a "-mouseovers" value, a browser dialog box will appear alerting him that the link is not valid. This is due to a technical limitation of the HTML necessary to do mouseovers.
Specifies the name to be used in the generated HTML for the image map. The default is "GDChart.[pid]" where "[pid]" is the Unix or Windows process-id of the calling CGI program. This allows each CGI program to be tied to the chart(s) it creates without conflicts.
Specifies the number of pixels wide to use for "shadowing" on bar-charts. If specified and non-zero, a "shadow" effect will be produced above and just to the right of each composite bar. The color is determined by the "-shadowcolor" option and defauls to black.
Specifies the color to use for shadowing (if "-shadow" is specified and non-zero). The default is 'black' unless the "-bgcolor" option is set to 'black', in which case, it defaults to 'gray'.
Optional single numeric value or a list of numeric values specifying that vertical lines should be drawn between various bars in bar-type charts. For example, if there are 10 x-values (10 bars), specifying a value of [1, 3, 6] would cause a vertical line to be drawn after the 1st, third, and sixth bars.
Optional list of string values to be printed above the vertical lines specified by "-barseps". The default is to "right-justify" the string such that the 1st character appears above the vertical line. To center or left-justify the string, above the line, append a "<" or "|" as the 1st character of the string.
Optional list of string values to be printed below the chart describing each of the vertical lines specified by "-barseps".
Optional string to print just before the "xlegend" values below the chart.
Optional string to print just before the "-lnlegend" values below chart.
Bar/Line combo-charts: Default 0. By default, if "-ylnvals" is specified and therefore dual axes are being plotted, lines are plotted against the right legend and bars are plotted against the left legend. If set, then lines will be plotted against the left legend.
Add small vertical tic-marks at top and bottom of the chart for each x-value.
LINE charts only: Default 0. Specifies that the chart is to be drawn as a "rockpile" or "sediment"-style chart instead of a traditional line-chart. This means that the lines are drawn and the area between them is shaded in. The y-values are also plotted in a "stacked" style such that the lines do not intersect. Y-values should all be positive. Also, no horizontal grid-lines will be drawn.
There are currently two styles of rockpile charts. If "-rockpile" is set to "1", the lines will be plotted in traditional line-chart style with symbols at the plot-points, but with stacking and shading between lines. If "-rockpile" is set to "2", a true "rockpile" style is used (no symbols are plotted for the points, only the lines are drawn, but stacked and with shading in between.
GANT charts only (Required Field) -- Specifies the low end of the date-range to plot. (format: yyyymmdd).
GANT charts only (Required Field) -- Specifies the high end of the date-range to plot. (format: yyyymmdd).
GANT charts only (Required Field) -- Specifies list of start times to plot (format: yyyymmdd). Must be one start time for each task in the "-tasks" list.
GANT charts only (Required Field) -- Specifies list of end times to plot (format: yyyymmdd). Must be one end time for each task in the "-tasks" list.
GANT charts only -- If true, specifies that the actual date is not to be displayed next to the "diamond" for plotted values whose start and end dates are the same. Normally the date is displayed just right of the diamond if the start and end dates are the same (or just left, if not enough room on the chart remains to the right). list.
The chart routines return either 1 or 2 values, depending on whether the "-link..." options are specified making the image clickable. The 1st return value represents the PNG image to be displayed. It must first be written to a temporary file by the CGI program before it can be displayed. The second contains the generated HTML for the image map if the image is to be clickable.
Example:
my ($png,$imagemap) = &BarChart(
	-xvals => \@xvalues,
	-yvals => \@yvalues,
	-xlegend => \@xlegend,
	-maxxsiz =>500,
	-maxysiz =>250,
	-ybase =>0
	);

	if (open(PNG,">/tmp/mypng.$$.png")) {
		binmode PNG;
		print PNG $png->png;
		close PNG;
	}
Here, $png contains the png image. It is written out by the CGI program to a temporary file "/tmp/mypng.[pid].png" for reference in your generated HTML. The variable "$imagemap" should be merged into your generated HTML to make the image clickable.
Pie Chart:
Code:
@l1 = (10,20,30,40,28,3,5,11,17,20);
	($g,$imap) = &PieChart(
		-xvals => [qw(cats dogs pigs cows alligatorshorses pigs osterages emus chickens)],
		-yvals => \@l1,
		-title => 'Title',
		-xtitle => 'x-title',
		-ytitle => 'y-title',
		-headercolor => 'DarkGreen',
		-border => 3,
		-linkpath => "http://webster.lmtas.lmco.com/~turnerj/cgi-bin/rca.pl?pgm2=$pgm\&rel_date=$yr$mo\&caus=",
		-mapname => "rcamap0",
		-links => \@l1
		);
Stacked Bar Chart:
Code:
	($g2) = &StackChart(
		-xvals => ["black\nangus\ncows",'alligators',"wild\nsassy\nhorses",'pigs','osterages'],
		-yvals => \@l1,-ybase=>0,
		-maxysiz => 400,
		-yhival => 50,
		-maxxsiz => 600,
		-showvalues => 'total',
		-title => 'Title',
		-xtitle =>'x-title',
		-ytitle => 'y-title',
		-lmgn => 50,
		-ybase => 0,
		-yInc => 10,
		-yinc => 2,
		-border => 0,
		-xlegend => [qw(us them others)],
		-valxcolor => 'red',
		-headercolor => 'DarkGreen'
		);
Gant Chart:
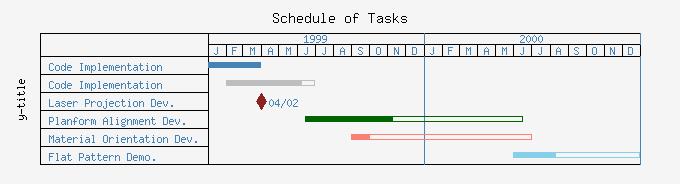
Code:
	use GDgantchart;

	@tasks = ('Code Implementation','Code Implementation','Laser Projection Dev.',
		'Planform Alignment Dev.','Material Orientation Dev.',
		'Flat Pattern Demo.');

	for $i (1999..2000)
	{
		for $j (1..12)
		{
			push (@xticks,sprintf('%-4.4d%-2.2d%-2.2d',$i,$j,1));
		}
	}
	push (@xticks,'20010101');
	@taskstarts = ('19990101','19990201','19990402','19990615','19990831',
			'20000601');
	@taskends = ('19990331','19990630','19990402','20000615','20000701',
			'20001230');
	@completes = (1, .85, .9, .4, .1, .33);

	($g0,$map0) = &GantChart(
		-xvals => [qw(J F M A M J J A S O N D J F M A M J J A S O N D)],
		-tasks => \@tasks,
		-title => 'Schedule of Tasks',
		-ytitle => 'y-title',
		-starttime => '19990101',
		-endtime => '20001231',
		-tmgn => 20,
		-bmgn => 20,
		-xminlegendsiz => 160,
		-xticks => \@xticks,
		-xbreaks => ['20000101', '20010101'],
		-xtlegend => ['1999', '2000'],
		-starttimes => \@taskstarts,
		-endtimes =>   \@taskends,
		-complete => \@completes,
	);